How to Use Call Centre Reporting
Stats Grid
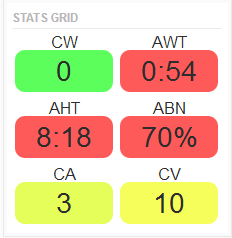
A colour-coded stats grid shows the following information:
- Green = value accepted.
- Yellow = value is within the range of your lower threshold.
- Red = value meets or exceeds your upper threshold.
- White = no thresholds are configured for the statistic.
To edit the stats grid
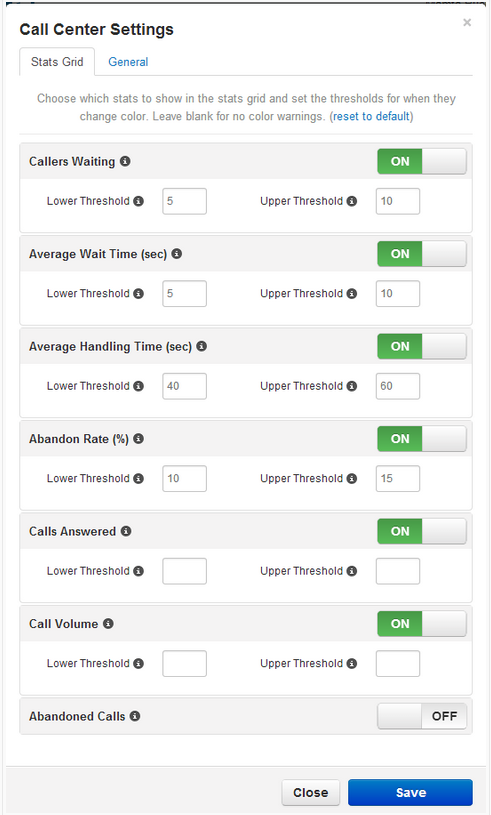
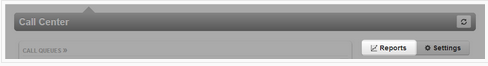
- Click the Settings button above the stats grid. The Call Center Settings page appears, with the Stats Grid tab displayed.
- Configure the Lower and Upper Thresholds for the statistics you want to show on the stats grid.
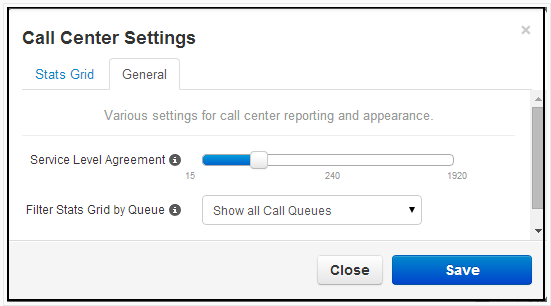
- Click the General tab.
- Use the Service Level Agreement slider to specify a value that will be used to calculate the Service Level Percentage statistic. This value determines whether a call was answered in an acceptable amount of time (seconds).
- Use Filter Stats Grid by Queue to determine whether the stats grid is shown for all call queues or one specific call queue.
- Click Save.
Call Centre Reporting
In Manager Portal versions 1226 and later, the Portal can generate custom reports about call queues. These reports provide a graphical overview of call centre statistics over a given period of time. The reports can cover the entire call centre, queues, or individual agents. This granularity enables call centre supervisors to monitor their call centre.
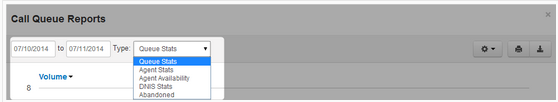
To generate call centre reports:
- On the Call Center page, click the Reports tab.
- Select a date range.
- Use the Type drop-down list to select the type of report you want to generate: Queue Stats, Agent Stats, Agent Availability, DNIS (Dialed Number) Stats, or Abandoned.
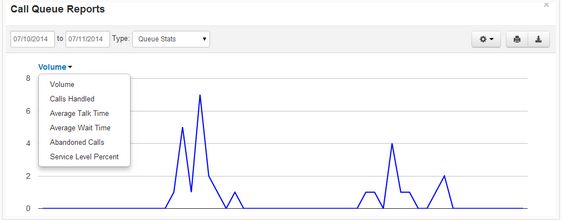
Queue Stats
The Queue Stats report allows supervisors to view specific attributes on a queue-by-queue basis based on user-configurable attributes.
The drop-down list allows you to select the information that will appear on the report.
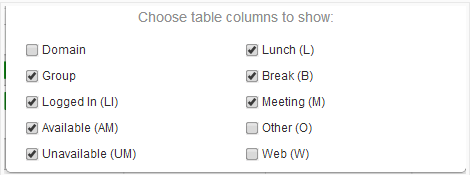
To change the available configuration fields, click the Table Settings gear from the pop up. When a list of check boxes appears, check the fields you want displayed and uncheck the ones you want to hide.
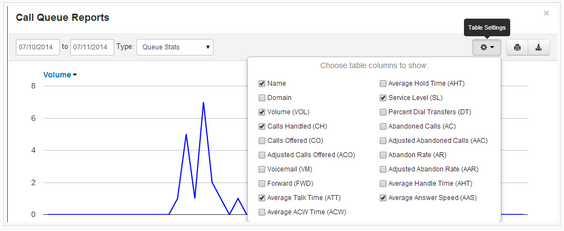
NOTE: You can click the check boxes in the first column for Call Queue statistics to graph them individually. Clicking the first column header (the bar graph icon) toggles all check boxes on or off.
Stats Available by Call Queue
- Volume (VOL): Overall calls per queue, including calls that never made it all the way through the auto attendant.
- Calls Handled (CH): Number of calls per queue that were answered.
- Calls Offered (CO): Number of calls that landed in the queue.
- Adjusted Calls Offered (ACO): (Number of calls offered) minus (calls abandoned in under 10 seconds).
- To Vmail: Number of calls handled by the automated voicemail system.
- Forwarded: Number of calls forwarded to another queue or offnet phone number for handling.
- Avg Talk Time (ATT): Average time agents spent talking to customers, excluding hold time.
- Avg After Call Work (ACW): Average time between the end of the call and when the agent submits the disposition.
- Avg Hold Time (AHT): Average time that a customer was on hold, excluding time in the queue.
- Service Level (SL): Percentage of calls answered from the queue within 60 seconds. Other time windows are available.
- Dial Transfers (DT): Percentage of calls that landed in the queue and were eventually transferred out to an agent.
- Abandoned Calls (AC): Number of calls that hung up from the queue before being transferred out to an agent.
- Adjusted Abandon Calls (AAC): Number of calls abandoned in under 10 seconds.
- Abandon Rate (AR): Ratio of abandoned calls to calls offered.
- Adjusted Abandon Rate (AAR): Ratio of adjusted abandoned calls to adjusted calls offered.
- Avg Handle Time (AHT): Average of talk time + hold time + disposition time.
- Avg Answer Speed (AAS): Average time in the queue for calls that were eventually dispatched to an agent.
Agent Stats
The Agent Stats report shows various agent statistics over time.
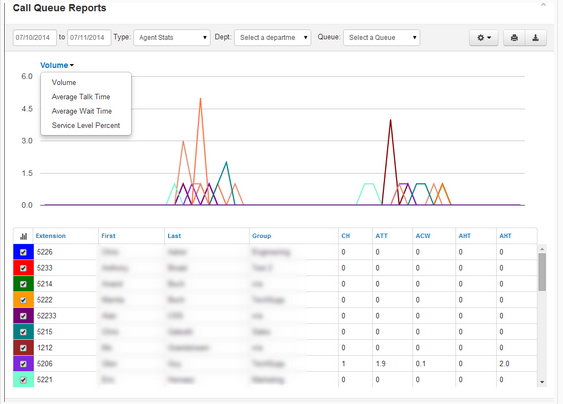
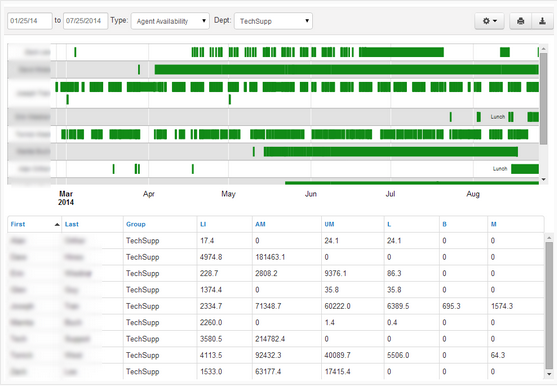
Agent Availability
The Agent Availability report shows the availability of agents in the domain or in a department within a domain. You choose the values to be graphed.
When configured, and when agents have been signing in and out, supervisors can see an agent availability display similar to the following.
Stats Available by Agent
- Calls Handled (CH): Number of calls per queue that were answered.
- Avg Talk Time (ATT): Average time agents spent talking to customers, excluding hold time.
- Avg After Call Work (ACW): Average time between the end of the call and when the agent submits the disposition.
- Avg Hold Time (AHT): Average time that a customer was on hold, excluding time in the queue.
- Avg Handle Time (AHT): Average of talk time + hold time + disposition time.
- Logged in Hours (LI): Number of hours the agent logged in over the time span.
- Talking Time (TT): Number of total minutes spent on calls.
- Available (AM): Amount of time spent in Available state.
- Unavailable (UM): Amount of time spent in Unavailable state.
- Lunch (L): Amount of time spent in Lunch state.
- Break (B): Amount of time spent in Break state.
- Meeting (M): Amount of time spent in Meeting state.
- Web (W): Amount of time spent in Web state.
- Other (O): Amount of time spent in Other state.
- Outbound Attempt (OATT): Number of attempted outbound calls made by the agent in the given window.
- Outbound Answered (OANS): Number of outbound calls answered from the agent in the given window.
- Outbound Minutes (OM): Total minutes on outbound calls made by the agent in the given window.
- Outbound Average (OAvg): Average time per call on outbound calls made by the agent in the given window.
- Inbound Answered (IANS): Number of total inbound calls answered by the agent in the given window from hunt group and direct.
- Inbound Minutes (IM): Total minutes on inbound calls answered by the agent in the given window from hunt group and direct.
- Inbound Average (IAVG): Average time per call on inbound calls made by the agent in the given window from hunt group and direct.
DNIS Stats
The DNIS stats report shows information based on the Dialed Number Identification Service (DNIS). DNIS is a telephone service that informs the receiver about a call that the caller dialed. DNIS is a common feature of 800 and 900 services. If you have multiple 800 or 900 numbers to the same destination, the DNIS tells you which number was called.
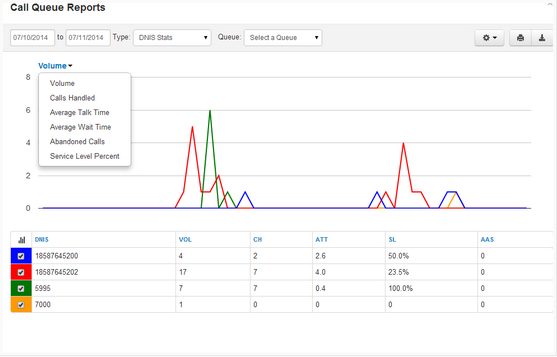
NOTE: You can click the checkboxes in the first column for DNIS statistics to graph them individually. Clicking the first column header (the bar graph icon) toggles all checkboxes on or off.
The stats available by DNIS mirror the call queue statistics above (Volume, Calls Handled, Calls Offered, Adjusted Calls Offered, To Vmail, Forwarded, Avg Talk Time, Avg After Call Work, Avg Hold Time, Service Level, Dial Transfers, Abandoned Calls, Adjusted Abandon Calls, Abandon Rate, Adjusted Abandon Rate, Avg Handle Time, Avg Answer Speed) plus Available Minutes (AM): overall time that all queue agents were in the Available state.
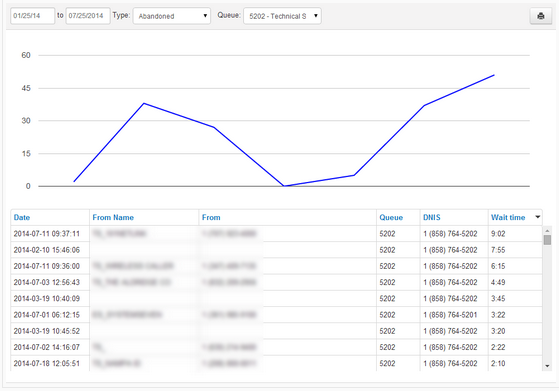
Abandoned Calls
The Abandoned Calls report shows call centre graphs for abandoned calls, organized by individual queues. Time is measured along the x axis and the number of calls abandoned is measured along the y axis. All of the abandoned calls for the queue appear below the graph, along with statistics about each individual call.
If you have questions or need assistance with call centre reporting, call us at (905) 564-3200.
